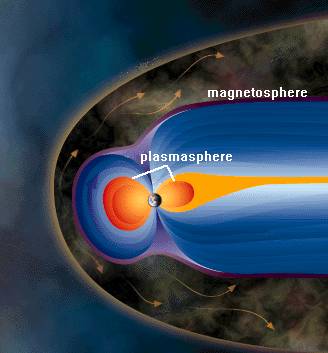
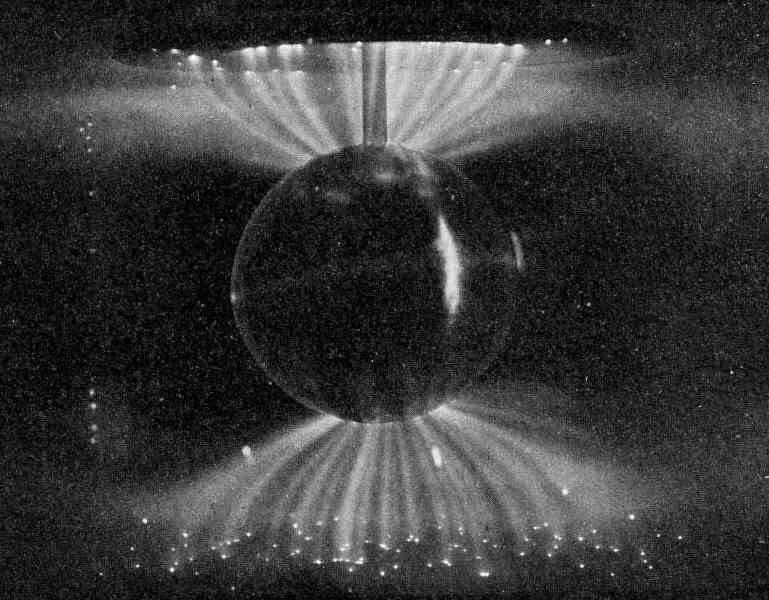
When the “Gannon” superstorm struck in May 2024, Earth’s plasmasphere-the doughnut-shaped shell of cold, charged particles that co-rotates with the planet’s magnetic field-collapsed to an altitude of just 9,600 kilometers, a level never before recorded by modern instruments. This sudden compression, from its typical 44,000 kilometers, removed five-sixths of the layer in less than half a day and exposed satellites to conditions normally buffered by this protective plasma reservoir.
1. Arase’s First Direct Measurements of a Plasmasphere Collapse
The Japan Aerospace Exploration Agency’s satellite Arase was launched in 2016 to study plasma waves and magnetic fields. The satellite was luckily positioned to catch the collapse of the plasmasphere in real time. According to Dr. Atsuki Shinbori, a scientist at Nagoya University, “We followed the changes of the plasmasphere using the Arase satellite and employed ground-based GPS receivers to monitor the ionosphere, which is the source of charged particles that refill the plasmasphere.” This monitoring of the two layers provided the first continuous dataset demonstrating the plasmasphere’s rapid inward motion during a superstorm and its unusually slow recovery.
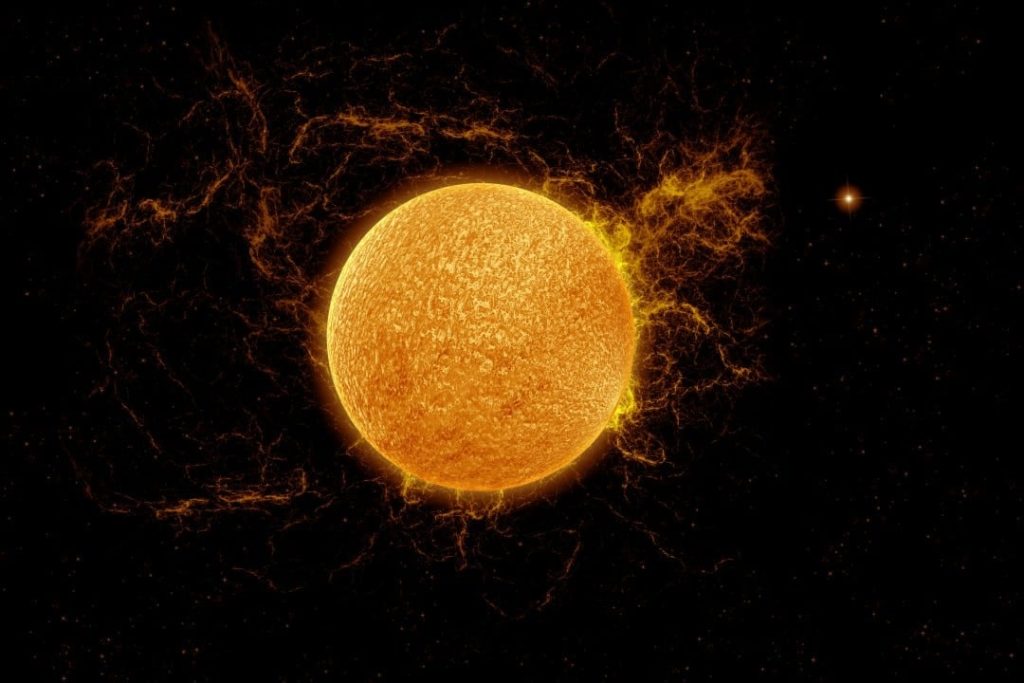
2. Solar Eruption Dynamics and Magnetospheric Compression
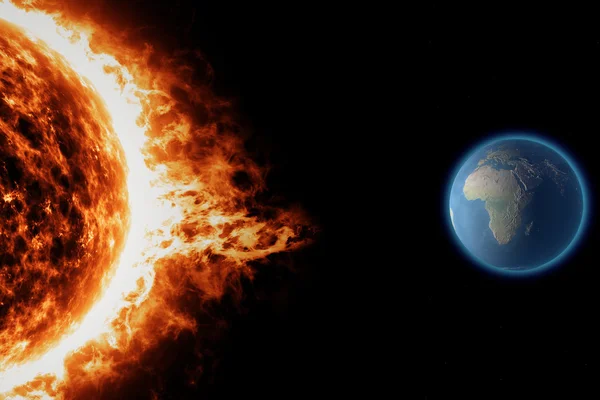
The Gannon storm was created by several CMEs from complex active regions that coalesced on the path toward Earth. WSA–ENLIL+Cone model results showed that a CME starting on May 9 overtook and combined with a previous CME that started on May 8, resulting in a continuously strongly southward IMF Bz which was sustained for several hours, driving vigorous magnetic reconnection at the dayside magnetopause, pushing the plasmasphere inward and sending the magnetopause inside geosynchronous orbit for many hours.

3. Chemistry of Negative Storms and Recovery Time
Usually, ionospheric protons replenish the plasmasphere in one to two days. Recovery took more than four days in May 2024 because of a severe “negative storm” phase. The heating was so intense that it changed the chemistry of the upper atmosphere, suppressing oxygen ions necessary for the creation of hydrogen. This severed the particle supply line from the ionosphere, an important coupling mechanism between the layers that had not been clearly seen before.

4. Supersubstorms and Energy Deposition
The analysis of the geomagnetic indices showed that there were six supersubstorms in this event, with SML less than −2500 nT: two in the main phase and four in recovery. These were driven by various factors involving IMF polarity changes, solar wind density pulses, and direct driving due to high solar wind electric fields. During some supersubstorms, Joule heating rates were higher than 90 × 10¹¹ W in specific sectors of magnetic local time, putting great energy into the polar ionosphere and thus further disturbing plasma circulation.
5. Auroral Expansion to Mid-Latitudes
Compression of Earth’s magnetic field allowed charged particles to travel along field lines far toward the equator. Auroras appeared in Mexico, southern Europe, and Japan-regions rarely touched by such displays. These low-latitude auroras are a visual indicator of extreme geomagnetic disturbance and correlate with severe magnetospheric compression events.
6. Satellite Radiation Belt Hazards
The collapse changed the spatial distribution of electron density, favoring the accumulation of high-energy particles in the inner magnetosphere. So it is under these conditions that the relativistic “killer” electrons pose an enhanced risk: during a strong storm, they can increase by orders of magnitude and penetrate to spacecraft shielding. Various studies indicate that in worst-case events, internal charging currents may be reduced to safe levels only by as much as 2.5 mm of aluminum shielding, well beyond that used in many satellites.

7. GPS Positioning Errors and Economic Impact
During the storm’s main phase, standalone GPS precise point positioning errors reached 70 meters in the Central United States, while outages affected farming equipment and were estimated at a $500 million loss. Such errors were associated with steep ionospheric plasma gradients and scintillation near the equatorward boundary of the ionospheric trough. In the Southwest, 10–20 meter errors resulted from refractive bending of signals in storm-enhanced density regions.
8. Limitations to Forecasting in Extreme Events
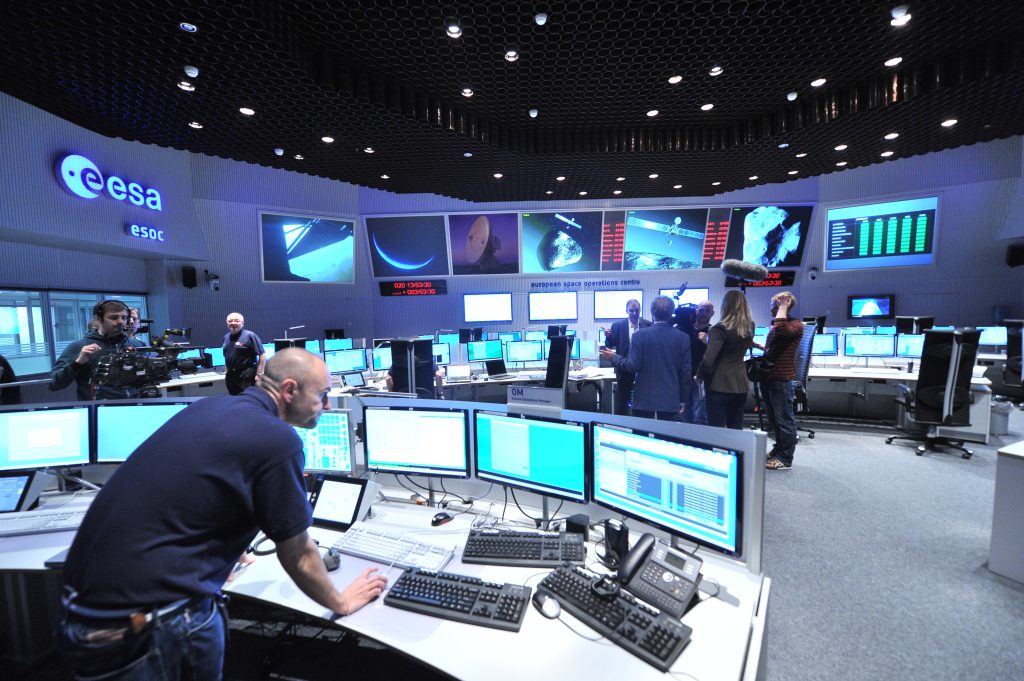
Space weather forecasting is based on near-real-time solar wind and IMF data from the ACE, DSCOVR, and Wind assets. During extreme events, instruments can be saturated by solar energetic particles, making data less reliable. Models like the Neustrelitz/ESOC Plasma Pause Model use geomagnetic indices like Dst to predict the location of the plasmapause; however, the complexity introduced by CME-CME interactions and supersubstorm dynamics is not yet captured in current operational models.
9. Engineering Resilience for Future Storms
In this respect, mitigation strategies include hardening of spacecraft, radiation belt models that contain wave-particle interaction, and real-time ionospheric corrections to navigation systems. The May 2024 event underscored the importance of multi-instrument intensive monitoring, coupling ionospheric and plasmaspheric data for predicting both the rapid collapses and the protracted recovery phases that can extend technological disruption. The record collapse and delayed recovery of the Gannon superstorm plasmasphere brings up vulnerabilities in Earth’s space environment and in the systems dependent on it. From unexpected latitude auroras to the outages of GPS and the increased radiation exposure for satellites, it presents a critical dataset to refine space weather prediction and engineering defenses against the next extreme solar assault.

