
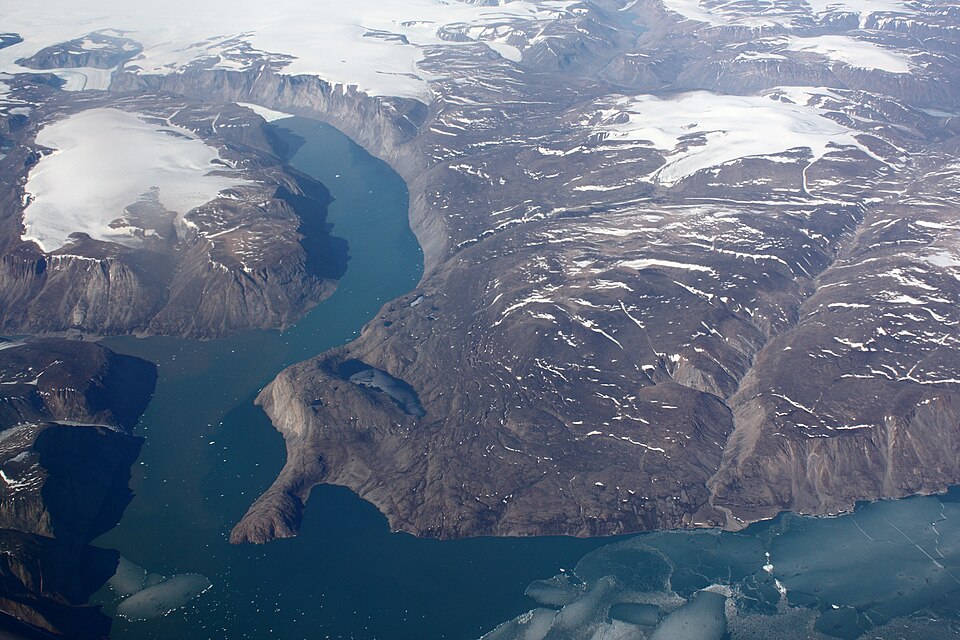
Few occurrences in the annals of history have had the unprecedented effects on both the sea and solid Earth that the incident on Dickson Fjord in Greenland had. This occurred on the 16th of September in the year 2023, when the remote location of the Dickson Fjord witnessed an earth-caliber reaction so tremendous in nature that the “ringing” effects could be “heard” on the planet’s crust for nine days! The immediate cause of this earth-shattering situation was the massive rock-ice avalanche that went crashing into the fjord, triggering the creation of an astonishing “650 feet” mega tsunami.
1. Collapse from 1,200 Meters Above
The disastrous events began when a volume of metamorphic rock and glacier ice estimated to fill 10,000 Olympic swimming pools, or 25 million cubic meters, broke loose from the top of the Hvide Støvhorn mountain standing 1,200 meters above sea level. The failure plane for this event angled at a rate of 45°, suggesting that this body moved through a steeper glacier valley as it gained more speed when mingling with 2.2 million cubic meters of glacier ice along its path toward the fjord’s surface, which it hit with speeds of almost 47 m/s.

2. Birth of a Confined-Water Mega-Tsunami
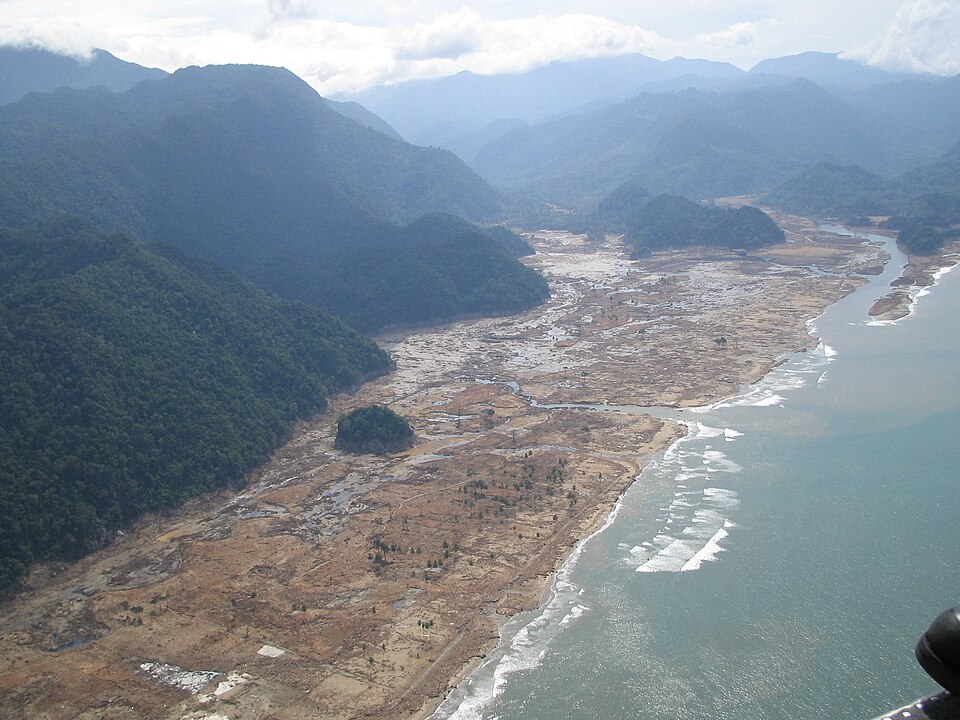
The favorable geometry of Dickson Fjord, with a cross-sectional dimension of 540 m deep and 2.7 km wide, and close-to-parallel coastline, led to very strong amplification of intense waves. The first wave produced a back-splash with a runup of approximately 200 m, and later, very strong waves of a maximum height of 110 m racing through Dickson Fjord. At Ella Island, which was 72 km away from Dickson, heights of 4 m were recorded, breaching research infrastructure worth $200,000 and damaging cultural heritage sites.
3. Transition to a Seiche
Instead, the tsunami’s energy became locked, oscillating between the walls of the fjord in a “standing wave” called a seiche. “Numerical models, with high-resolution bathymetry and Manning bottom friction coefficients, indicated the establishment of a 7.4-meter amplitude oscillation with a resonance period of approximately 90 seconds,” and this was “like a horizontal piston pushing against the fjord bottom, with a cycling force of 5 × 10¹¹ newtons pushing against the Earth’s crust.”
4. Seismic Signature of the Fjord Oscillation
Global seismometers observed a monochromatic Very Long Period (VLP) wave at a frequency of 10.88 mHz, corresponding to a period of 92 seconds. The waveform was coherent and showed a nonexponential decay with a rise in the quality factor (Q) from approximately 500 to 3,000. Rayleigh waves were observed perpendicular to the fjord, while Love waves were observed along the fjord.
5. Satellite Altimetry Breakthroughs
The Surface Water and Ocean Topography (SWOT) satellite, launched in December 2022, delivered unparalleled spatial resolution. While traditional radar altimeters conventionally recorded data along a single track, SWOT recorded data across a swath of 30 miles at resolutions of 8 feet. The JK Flow experiments involved recording water accumulations on one side of the fjord, which were higher by 1.2 meters, as observed in the seiche’s cross-channel profile. Bayesian regression analyses of pixel cloud data incorporated geophysical corrections for tides, tropospheric delays, and geoid.
6. Numerical Simulation Techniques
Scientists integrated Boussinesq models for dispersive wave propagation and algorithms in nonlinear shallow water flooding in order to simulate runup heights that could be verified by observations. Indeed, HySEA granular flow models represented avalanche-water interactions; tests of grid size and bottom friction further helped measure energy retention. Also, a sharp bend in a closed fjord reduced effluent discharge; this was why the seiche in this fjord lasted longer than in an open basin in Alaska the Taan Fjord.
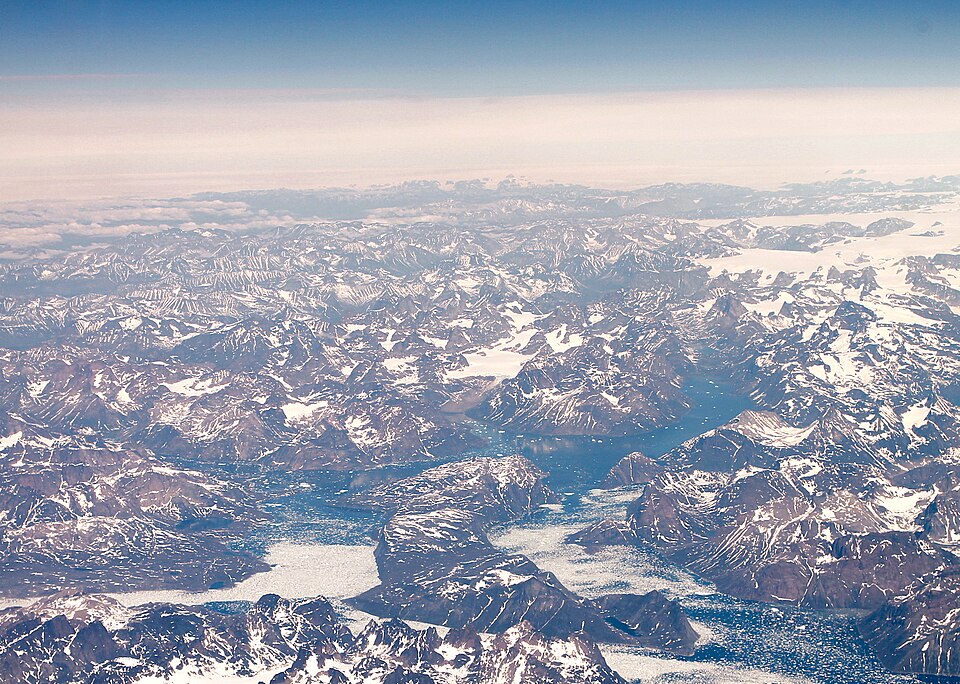
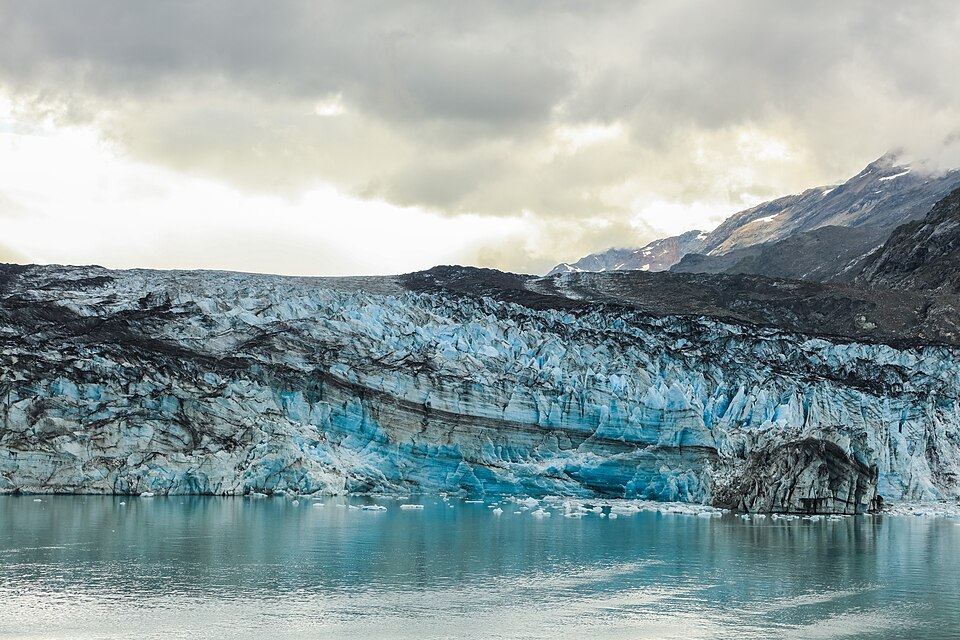
7. Climate-Driven Destabilization
Glacier debuttressing, which refers to the loss of glacial ice supporting mountain slopes, is a significant catalyst for paraglacial landslides. Recent research based on data obtained from satellites indicates that the retreat and thinning rates of the Greenland Outlet Glaciers are measured in meters per year, leading to a reduction in rock masses’ stability. This can be attributed to the occurrence of similar scenarios in Alaska, Barry Arm, and Tungnakvíslarjökull, Iceland.
8. Hazard Monitoring and Early Warning
This incident emphasizes the importance of comprehensive monitoring systems in polar areas. A combination of real-time seismic data with high-resolution altimetry would offer warning times of minutes for vessels or settlements within tsunami-risking fjords. High-rate sea-level sensors within closed basins would allow the direct measurement of short-timescale fluctuations, leading to rapid risk assessment.
9. Unpacking the Seismic Vault
With the Dickson Fjord seiche described, researchers are currently examining historical seismic data for other instances of this monochromatic seismic activity. At least four other events from the same gully have now been found to occur in the Dickson Fjord region, with two of these events having taken place beneath the winter sea ice in 2016 and other years.
The Dickson Fjord mega tsunami and its nine-day seismic response provides one such dramatic illustration of the Earth system cascade, in which cryospheric change sets off lithospheric motion, which then induces hydrospheric extreme events that can be traced globally.

