
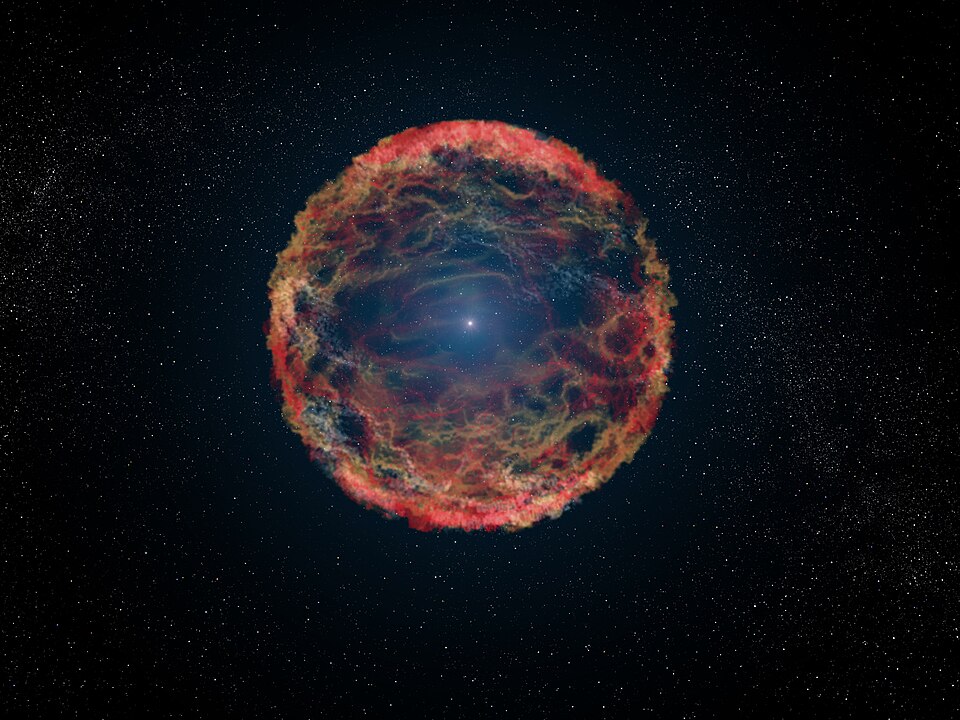
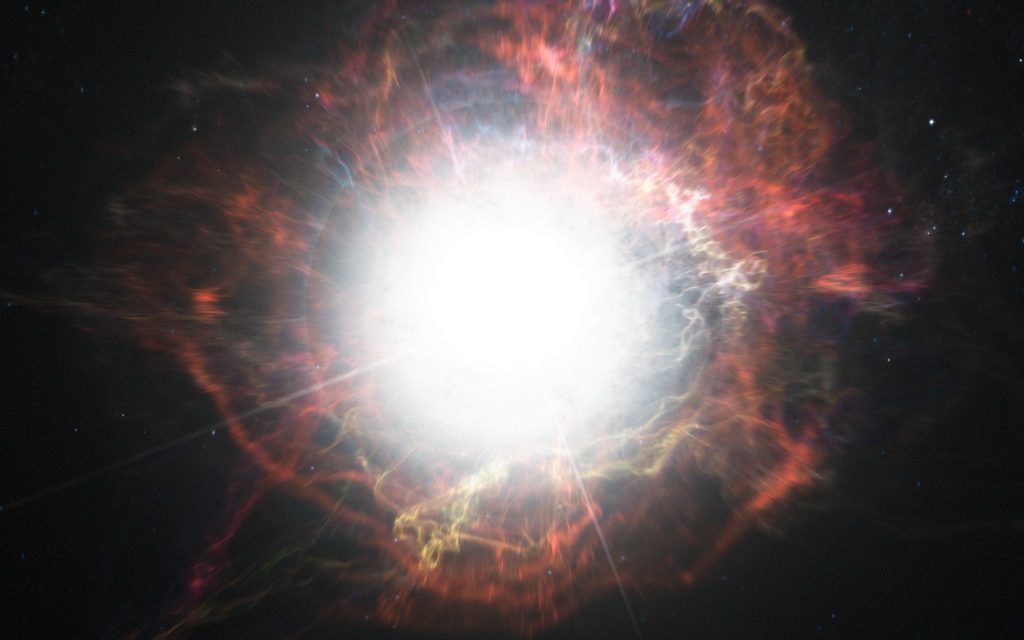
It’s a rare privilege for astronomers to witness in real time a star’s death, and rarely do they witness the very first hours of its explosive unraveling. This past April 2024, however, 26 hours after light from the supernova SN 2024ggi first reached Earth, the European Southern Observatory’s Very Large Telescope in Chile trained its FORS2 spectropolarimeter on the event. What followed was the first-ever spectropolarimetric mapping of the geometry of a supernova from such an early stage, showing the shape of the shock front as it burst through the star’s surface.
1. A Race Against Time
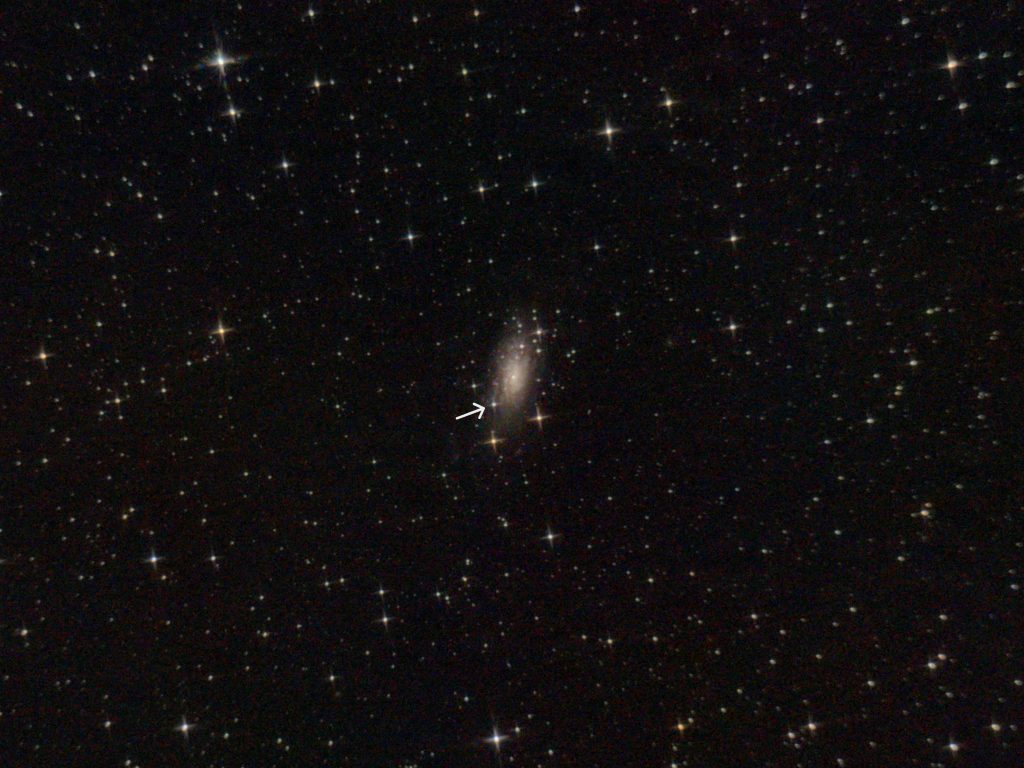
SN 2024ggi was discovered on April 10 by the Asteroid Terrestrial-impact Last Alert System (ATLAS) in the spiral galaxy NGC 3621, 22 million light-years away. Within hours, Yi Yang of Tsinghua University had submitted an urgent observation request to ESO. By April 11, the VLT was gathering polarized light data critical because the shock-breakout phase only lasts a few hours before the geometry of the ejecta is scrambled by interaction with surrounding gas.
2. Why Spectropolarimetry Matters
Spectropolarimetry is the measurement of polarization across wavelengths, a property encoding three-dimensional information about unresolved astrophysical structures. In a perfectly spherical source, polarization cancels out any net polarization betrays asymmetry. “Spectropolarimetry gives information about the geometry of the explosion that other types of observation cannot provide because the angular scales are too tiny,” said Lifan Wang of Texas A&M University. FORS2 was designed to make accurate Stokes parameter measurements. Such measurements allow the reconstruction of the symmetry axis of the explosion and its degree of asphericity.
3. The Olive-Shaped Shock Front
We see that the polarization continuum pattern on day 1.1 was aligned along one “dominant axis” in the Stokes Q–U plane, confirming a well-defined axial symmetry. The inferred photosphere was elongated, olive-like rather than spherical in geometry. This then prevailed in hydrogen-rich ejecta well after the shape flattened from collisions with CSM and so implied the asymmetry was imprinted deep in the explosion mechanism itself.

4. Dissecting the Explosion Mechanism
Two competing paradigms have emerged to explain how a stalling shock in a core-collapse supernova is rejuvenated: neutrino-driven heating and jet-driven outflows. Neutrino-driven explosions tend to give rise to irregular, convection-driven asymmetries, while jet or magnetorotational models naturally give rise to strong, bipolar symmetries. The persistence of SN 2024ggi’s axis from breakout through late ejecta expansion is more consistent with large-scale, directed outflows possibly jets than with stochastic neutrino heating.

5. The Progenitor and Its Final Moments
Archival constraints suggest the red supergiant progenitor had 12–15 solar masses and a radius ~500 R☉. Its iron core reached the Chandrasekhar limit, and gravitational collapse initiated an “infall-induced bounce shock.” The VLT’s earliest data caught photons diffusing out in preferred directions while other parts of the shock were still buried in optically thick CSM a fleeting view of the blueprint of the explosion.
6. Multi-Stage Geometry Evolution
Analysis has divided the event into three stages.
- Stage I (days 0.7–1.2): Shock breakout, axially symmetric, moderate asphericity (axis PA ≈ 133°).
- Stage II (days 2–7): Ejecta–CSM interaction, symmetry axis rotated (~110°), indicating misalignment between explosion axis and CSM distribution possibly from binary mass-loss shaping.
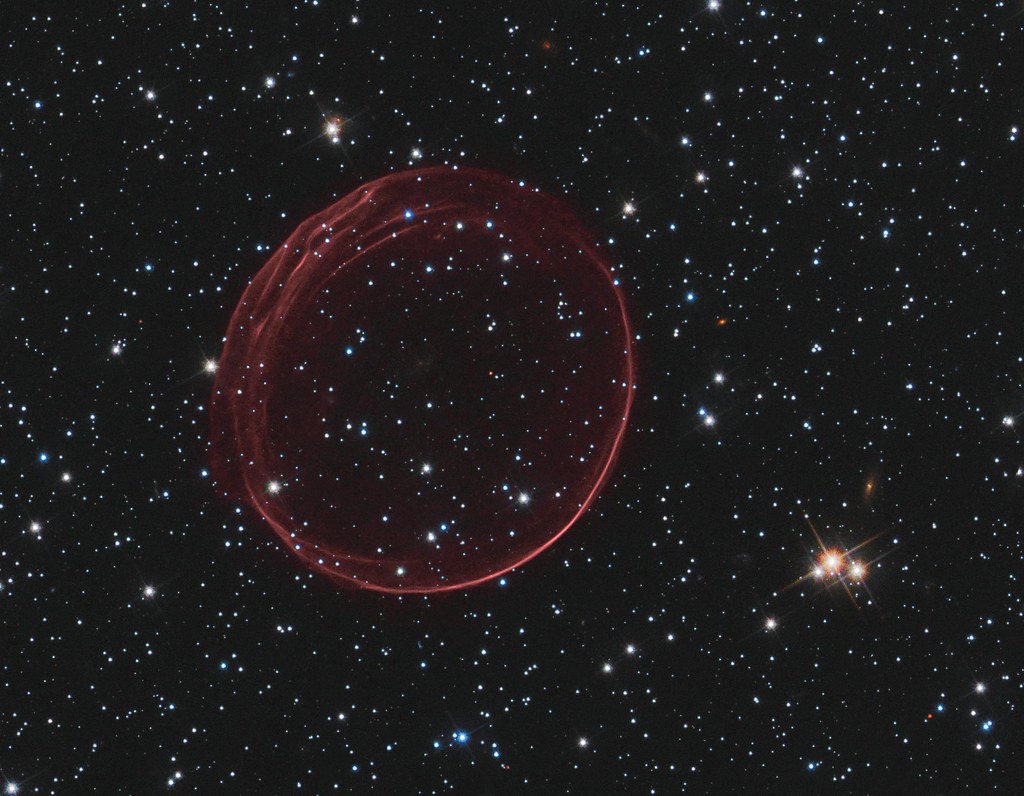
- Stage III (day 10.9+): Hydrogen-rich envelope dominates, symmetry axis realigns with Stage I and thus suggests a prolate-to-oblate transformation without losing large-scale axisymmetry.
7. Implications for Core-Collapse Physics
Observed moderate asphericity, represented by the axis ratios A ≈ 0.8–0.95, can naturally result from jet-driven or magnetorotational mechanisms without extreme collimation. In these models, the rotational energy with an amplified magnetic field channeled the outflows along the rotation axis, thus perpetuating the geometry for several weeks. This is in accord with 3D simulations of directional plumes piercing hydrogen envelopes and contrasts with the lower energies and amorphous ejecta typical of neutrino-only models.
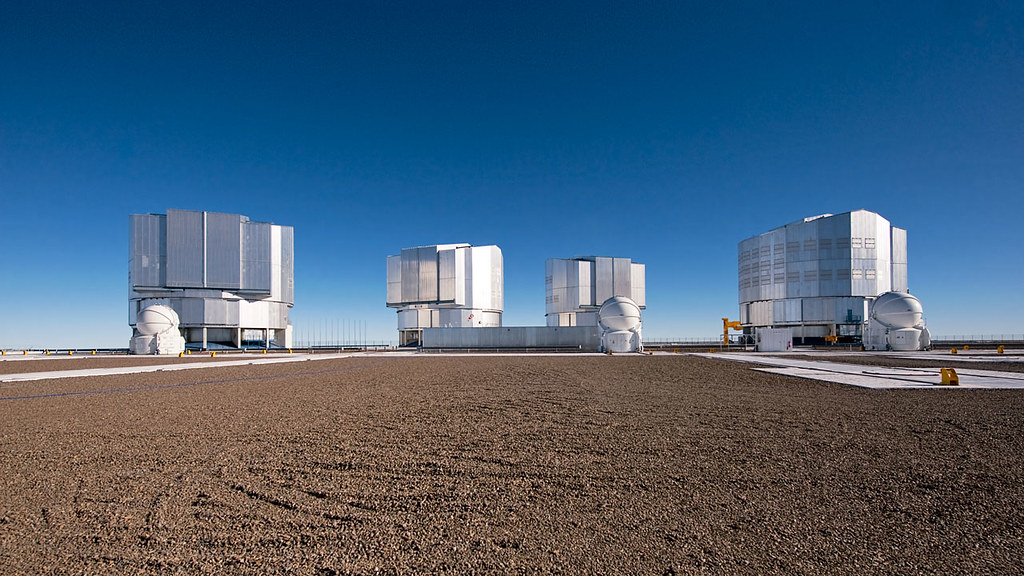
8. The Role of the Very Large Telescope
Only ESO’s VLT could provide such early-time spectropolarimetry at southern hemisphere facilities owing to its 8.2 m aperture and rapid Director’s Discretionary Time allocation. The low-resolution high-sensitivity mode of FORS2 was essential for the detection of polarization below 0.4% – a subtle signal carrying decisive clues about the 3D structure of the explosion.
9. A New Benchmark for Early Supernova Studies
SN 2024ggi is only the second hydrogen-rich core-collapse supernova with spectropolarimetry within days of breakout and the first within ~1 day. It thus provides a template for linking breakout geometry to long-term ejecta morphology -a “critical link” in the words of Yang for constraining explosion physics. It also underlines the importance of wide-field transient surveys feeding rapid-response, highresolution follow-up.
The findings narrow the viable models for massive star death bolster the case for large-scale, axisymmetric engines and show that with speed, coordination, and the right instruments, astronomers can now watch the Universe’s most powerful stellar detonations unfold from their very first breath.

